Texas Is the King of Greenhouse Emissions. It’s Also in the Path of the Climate Change Storm
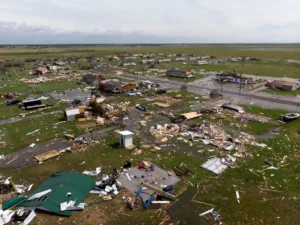
With hurricanes, wildfires and droughts, every region of Texas is threatened by man-made climate change, vulnerability index shows. The Texas state flag and American flag wave in the wind over an area of debris left behind in the wake of Hurricane Harvey, Sunday, Aug. 27, 2017, in Rockport, Texas. (AP Photo/Eric Gay)
Month after month, the weather reports in Texas this year have been harrowing — deadly heat waves across the state, record-breaking wildfires in the panhandle that burned a million acres of grasslands, a hurricane that killed 26 people and left thousands without electricity, a tropical storm that dumped 10 inches of rain and caused severe flooding, another that packed 100 mph winds, yet another that lobbed golf ball-sized hail in Houston, and a tornado in north Texas that killed seven and left half a million people without power. The onslaught was so relentless that by July, Gov. Greg Abbott had issued a disaster declaration including 125 counties, stretching from Houston up to the Oklahoma border and down to the Coastal Bend.
It was hardly an anomaly. In 2023 — the hottest year on record in Texas — residents in Austin suffered through 45 consecutive summer days over 100 degrees, another record. According to state climatologist John Nielsen-Gammon, eight of the 10 hottest years on record in Corpus Christi have occurred since 2011. In 2022, drought resulted in an estimated $17 billion in total losses to the Texas economy, including more than $2 billion among cotton producers alone, according to Comptroller Glenn Hegar. And in February 2021, Winter Storm Uri — the second freak freeze event in a decade — killed 246 people and caused between $80 billion and $130 billion in damage.
The grim picture is laid out vividly in the U.S. Climate Vulnerability Index, a joint production of Texas A&M scientists, the nonprofit Environmental Defense Fund and the data science firm Darkhorse Analytics. Built around an interactive map loaded with nearly 200 data sets, the index is a novel tool for exploring how climate change affects the diverse regions of Texas and the United States. The color-coded map confirms what many Texans already know: The Lone Star State is in the path of the climate change storm.
The Lone Star State is in the path of the climate change storm.
Texas has a direct role in its own whipsaw weather extremes as the undisputed national leader in greenhouse gas emissions. Texas’ industries and its 30 million residents are responsible for more than 873 million metric tonnes of carbon dioxide equivalent each year, equal to about 2.2 trillion gasoline-powered car miles, or the annual energy use of 114 million homes. Texas produces more oil and gas than any other state — 43% of the nation’s crude oil and 27% of its natural gas. Hundreds of thousands of active and inactive wells leak methane and other gases into the atmosphere, and massive concentrations of super-emitting refineries and petrochemical plants line the Gulf Coast.
Many Texas locales also lead the nation in vulnerability to the effects of climate change, from deadly heat waves and freezes to hurricanes, droughts, public health challenges, population loss, rising residential energy costs, declining agricultural productivity and a long list of less obvious climate-related factors.
All 254 counties in Texas, spanning two time zones and encompassing 260,000 square miles of diverse ecosystems, are vulnerable to challenges posed by manmade climate change, according to the index. But the threat is not distributed equally. Different regions of Texas — even different neighborhoods in the same city — face different problems.
On the index’s map, darker tones correspond to higher vulnerability, lighter tones to lesser vulnerability. The entire Gulf Coast of Texas, for instance, appears dark blue on the overall vulnerability map, which includes all of the risk factors, from the state of a census tract’s infrastructure to access to public health resources, frequency of severe weather events, proximity to ports and major industrial areas, average age of residents, even seemingly unrelated factors such as voter turnout and percentage of minority language speakers. Users can select a narrower category of factors, limiting the map to, say, social and economic factors or extreme events, and they can drill down into the reports for each category to see which data sets were included and read more detailed analyses.
The frequency of billion-dollar weather and climate disasters in Texas has spiked from fewer than four each year in the 1980s to approximately 11 each year from 2019 to 2023.
According to the index’s creators, all of the data that feed into the map’s visualizations, however obscure, have a relationship to climate change vulnerability. Aging populations are more susceptible to extreme heat and more likely to have expensive health-care costs; populations with low voter turnout may be isolated from local and state government, which means they may be less likely to demand climate action and less likely to receive helpful services; people who live in areas with high historic frequency of flooding may be more likely to suffer long-term economic fallout from storms; low-income areas with large heat islands will be more vulnerable to rising residential energy costs. For many Texans, these risks are not data points buried in a spreadsheet somewhere, or colored swatches on a digital map — they’re everyday realities.
Severe weather does not recognize state boundaries, and Texas is not the only state experiencing climate-related disasters. But according to data from the National Oceanic and Atmospheric Administration’s National Center for Environmental Information, Texas beats every other state in “billion-dollar weather events.” Since 1980, the agency has recorded 186 confirmed weather and climate disaster events affecting Texas with losses exceeding $1 billion each, from droughts to cyclones to wildfires. And the problem is getting worse: The frequency of billion-dollar weather and climate disasters in Texas has spiked from fewer than four each year in the 1980s to approximately 11 each year from 2019 to 2023. “Texas leads the nation in both the most frequent severe weather events and the most expensive, accounting for 15% of all U.S. billion-dollar disasters,” according to a review of the data by the nonprofit Texas 2036 Project.
Extreme weather and other climate change-related factors affect different neighborhoods according to well-established race- and income-based inequalities.
There is no region of Texas without at least one census tract rated as most vulnerable on the Climate Vulnerability Index, but the densest clusters of dark tones stretch along the Gulf Coast from the Louisiana border to Brownsville, where cities and rural areas alike are threatened by increased frequency and severity of storms, high temperatures, and in some cases, the vulnerabilities that come with aging infrastructure and housing, generational economic decline, racial inequality and poverty.
El Paso and the borderlands of far west Texas are solid dark, and so are the counties that flank the Pecos River, where extreme heat and prolonged drought have dried up surface water and pushed ranchers and farmers to the brink of ruin. Lubbock, in northwest Texas, and Amarillo, in the panhandle, both include tracts in the 99th percentile for overall vulnerability. Of all the major cities in Texas, Austin is the only one that does not have a single census tract above the 90th percentile for vulnerability. San Antonio, Houston and Dallas all have multiple tracts rated maximally vulnerable, and the most vulnerable tracts in those cities are often separated by only a few miles from tracts that rank as least vulnerable. It may be tempting to think of hurricanes and heat waves as nondiscriminatory, but the reality is that extreme weather and other climate change-related factors affect different neighborhoods according to well-established race- and income-based inequalities.
The census tracts along Houston’s “arrow” — where richer, whiter communities extend from the western suburbs toward the city center — appear pale, almost white. One of the arrow tracts, in Houston’s wealthy River Oaks neighborhood, where the median household income tops $110,000, ranks in the 26th percentile for vulnerability compared to every other census tract in the United States. The River Oaks tract is 98% white, just 2% Black. A nearby southwest Houston tract in the West University Place neighborhood, with a similar demographic profile to River Oaks — 83% white, 10% Asian — earned a 25th percentile rating. West University Place’s median household income of more than $250,000 is about four times the statewide household median income of $72,000.
Only a few miles to the north, east and south of River Oaks and West University Place, there are numerous tracts in the greater Houston area rated maximally vulnerable to climate change. There are multiple tracts in the periphery of Houston, which includes Northeast, Northside, the Greater East End and Pasadena — communities that are either majority Black or Latino — that rank in the 99th percentile overall, standing out for their vulnerability to high levels of pollution, flooding, industrial traffic, chronic health problems and potential economic and productivity losses related to climate change. In Pasadena, the median household income is about $65,000 per year, about 90% of the statewide median. In the other three neighborhoods, median household income is below $50,000.
“After [hurricanes] Rita and Ike, numerous businesses shut down and have never returned due to the natural disasters.”
That the inequality of climate vulnerability corresponds so neatly with racial and economic markers is difficult to ignore. As in so many U.S. cities, especially in the former Jim Crow South, development policies have tended to push industrial construction into Black and Latino neighborhoods and to preserve greenspace and undeveloped areas with clean air, clean water, and low noise levels for wealthier and whiter residents.
Related How Climate Change Is Driving Up Food Prices Around the World
Poverty, economic distress, insufficient access to insurance and health care services, reliance on dilapidated infrastructure and aging housing, proximity to polluting industrial facilities, urban heat islands and minimal access to government all contribute to increased vulnerability to climate change. For a case study in how racial and economic inequality correlates to divergent outcomes in the aftermath of natural disasters, look no further than Houston’s predominately Black and Latino Fifth Ward, where residents suffered the worst of Hurricane Harvey’s flooding in 2017 and were still recovering years later. To be sure, Harvey was a deeply unpleasant experience for residents of River Oaks, too — but not an existential threat.
“Previous hurricanes bear out the idea that we’re vulnerable to economic challenges of climate change,” said Jermey Houston, emergency management coordinator for the city of Port Arthur, a petrochemical hub and major energy port on the Gulf Coast that includes a census tract in the 99th percentile for climate vulnerability. “After Rita and Ike, numerous businesses shut down and have never returned due to the natural disasters.” Houston said he hasn’t been part of any official conversations at the level of city government about how to address climate change, but he has had to find money and staff during recent summers to set up cooling stations. “This is something we never really had to deal with in the past,” he said, “but it’s something we have to deal with now because of extreme heat.”
Judith Smith, Port Arthur’s director of health services, agreed with the Climate Vulnerability Index’s rating of Port Arthur in the 100th percentile of medically underserved areas. “That’s a given,” she said. “We have one federally qualified health care center and a primary care clinic within the health department, but many primary care providers have retired or left the area.” Almost one in four residents of one of Port Arthur’s most vulnerable census tracts is 65 or older, which places additional strain on the already overburdened city health system. Asked what she would like to see from the state and federal governments to address climate vulnerability, Smith said she wanted “clinics in every neighborhood in Port Arthur, because we have a transportation problem.”
At the opposite end of the Gulf Coast, Port Isabel City Manager Jared Hockema said he was surprised that his city, just north of the Mexican border, included a census tract in the 99th percentile for climate vulnerability, until he looked at the map and saw that the tract includes Laguna Heights, a flood-prone area that he and his colleagues in Port Isabel have been working to shore up against storm threats. Most of the rest of the city earned a 90th percentile rating, but Hockema said he takes climate change-related challenges seriously. “Having lived most of my life here and in South Padre Island, we’re experiencing more and more weather events and high tides that lead to street flooding — something we never had before,” he said. “We had a tornado last year, haven’t had one in 40 or 50 years.”
“I still have 20 square miles of town, but a huge chunk of the economy and the people who used to help maintain it are no longer here. It’s hard to maintain infrastructure with less people.”
Hockema said Port Isabel is focused on building resilience in the face of rising sea levels, increasingly frequent and destructive wind events, extreme heat and freshwater shortages due to declining annual rainfall. “We put in a living shoreline and a breakwater in town, we’re looking to expand breakwaters to reduce the impact of wave action on the shoreline, we’re changing drainage structures to enable them to function with higher tides,” he said. A desalination plant is in the planning stages to provide drinking water to Port Isabel and the Lower Rio Grande Valley. “We’re also promoting higher building construction standards, windstorm anchoring, heavier duty screws and bolts,” Hockema said, “all in the name of resilience.”
Big Spring, on the arid southwestern edge of the Great Plains known as the Llano Estacado, was built for 50,000 people, according to City Manager Todd Darden, but it has been losing people for decades. The city’s population is currently about 25,000. In Howard County, which includes Big Spring, agriculture “lives and dies off mother nature,” Darden said. Dryland cotton farming was the economic engine that built Big Spring in the 20th century, but the increasing frequency and duration of droughts and extreme temperatures have made farming a risky proposition. Thousands of families have moved away, and while the recent fracking boom in the oil and gas industry has brought more economic activity, the city has not replaced lost residents.
“I still have 20 square miles of town, but a huge chunk of the economy and the people who used to help maintain it are no longer here,” Darden said. “It’s hard to maintain infrastructure with less people.”
Darden said he had not seen the index — which ranks one of Big Spring’s census tracts in the 98th percentile for vulnerability — but he said he sees direct effects of climate change in Big Spring and the surrounding area every day. Darden said he watches the Weather Channel almost every night, and it seems like Howard County and neighboring Scurry County are in the 100s when nearby counties are in the 90s. “Today’s a cold snap, it’s only 98 now, but the rest of the week it’s been 104, 105 — we saw a whole month of 100 degree days last year,” he said. “The population decline is due to the loss of agriculture, which is due to climate, and loss of ranching, which is due to climate. I think the only thing keeping us afloat is the energy industry, which is now the No. 1 economic stimulus for our county, but now I also have earthquakes to deal with that I didn’t have to deal with before.” Darden recently felt a 5.1 magnitude tremor while he was at work.
The increasing frequency and duration of droughts and extreme temperatures have made farming a risky proposition.
In 2011, two years before Darden became city manager, Big Spring implemented an emergency drought contingency plan for the first time since 1950, requiring residents and commercial customers to sharply reduce their water use. In the aftermath, the city signed on to a regional $150 million project, managed by the Colorado River Municipal Water District, to develop groundwater storage to replace surface reservoirs, which suffer high rates of evaporation loss. Big Spring also built a reclaimed water plant, which recycles 100% of its wastewater and returns it either to the drinking water supply or to the local watershed. Darden said the 2011 water crisis was a wake-up call for Big Spring residents, who continued to use about 30% less water than pre-2011 levels even after the restrictions were lifted.
“Everybody should be cognizant of climate change, I know that in my heart,” Darden said. “We can’t just sit back and do what we’ve been used to for so many years. We gotta look at alternatives and solutions and be proactive.”
Hockema, Port Isabel’s city manager, was directly involved in the city’s successful suit to block federal permits for the construction of a liquified natural gas terminal within city limits, but he said local concerns related to air quality, disproportionate burdens on low-income Latino residents and economic impacts on the tourism and fishing industries motivated the objection to the project, even if he and many of Port Isabel’s residents share concerns about the global climate consequences of increased LNG production. He said Port Isabel could use more support from the state and federal governments to address climate change, but his most urgent priority doesn’t require any legislation or funding.
“We need more leadership on climate. We need a recognition across all levels of government that climate is a serious long-term issue that we all need to address, and it’s of long-term importance,” Hockema said. “We have taken actions because climate change is a threat to our citizens, and we’re doing everything we can, but leadership at the state and national level has failed to recognize this is a problem.”
Copyright 2024 Capital & Main
Your support matters…Independent journalism is under threat and overshadowed by heavily funded mainstream media.
You can help level the playing field. Become a member.
Your tax-deductible contribution keeps us digging beneath the headlines to give you thought-provoking, investigative reporting and analysis that unearths what's really happening- without compromise.
Give today to support our courageous, independent journalists.
 Environment
The Canadian influencer and his Project 2025 allies in the U.S. want people to see climate action as a ‘pseudo-religion.’
Environment
The Canadian influencer and his Project 2025 allies in the U.S. want people to see climate action as a ‘pseudo-religion.’
 Environment
In a portent of things to come, residents of Lake Charles, Louisiana, are still on the move four years after Hurricane Laura.
Environment
In a portent of things to come, residents of Lake Charles, Louisiana, are still on the move four years after Hurricane Laura.
 Editorial Cartoons
 Environment
A new study shows how federal grant funding has become an obstacle to climate adaptation.
Environment
A new study shows how federal grant funding has become an obstacle to climate adaptation.
 Editorial Cartoons
 Environment
Extreme weather disrupts supply, pushing up prices on common supermarket items everywhere.
Environment
Extreme weather disrupts supply, pushing up prices on common supermarket items everywhere.
You need to be a supporter to comment.
There are currently no responses to this article.
Be the first to respond.